Application Telemetry
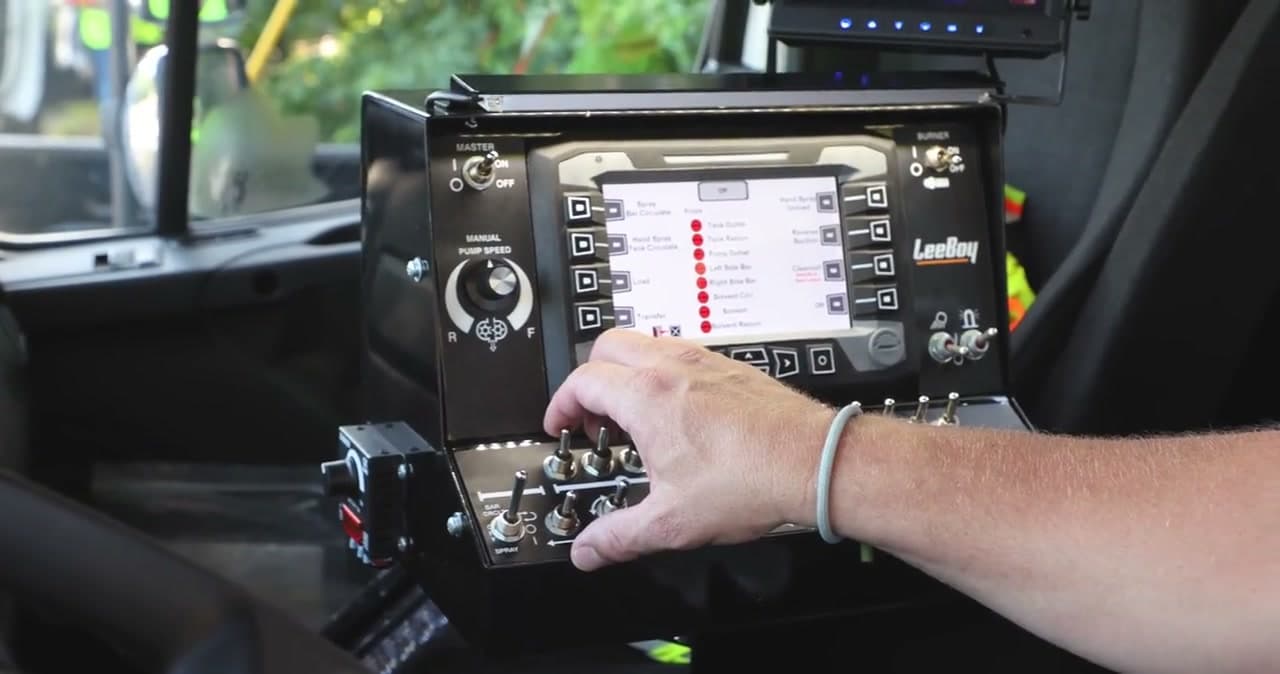
Onboard telemetry logs each bar’s commanded and delivered rate against the Engineer’s target, GPS-referenced by station and offset. Below is a sample record showing the format: one 50-ft interval per row, including a documented mid-run target change.
Built for Verification
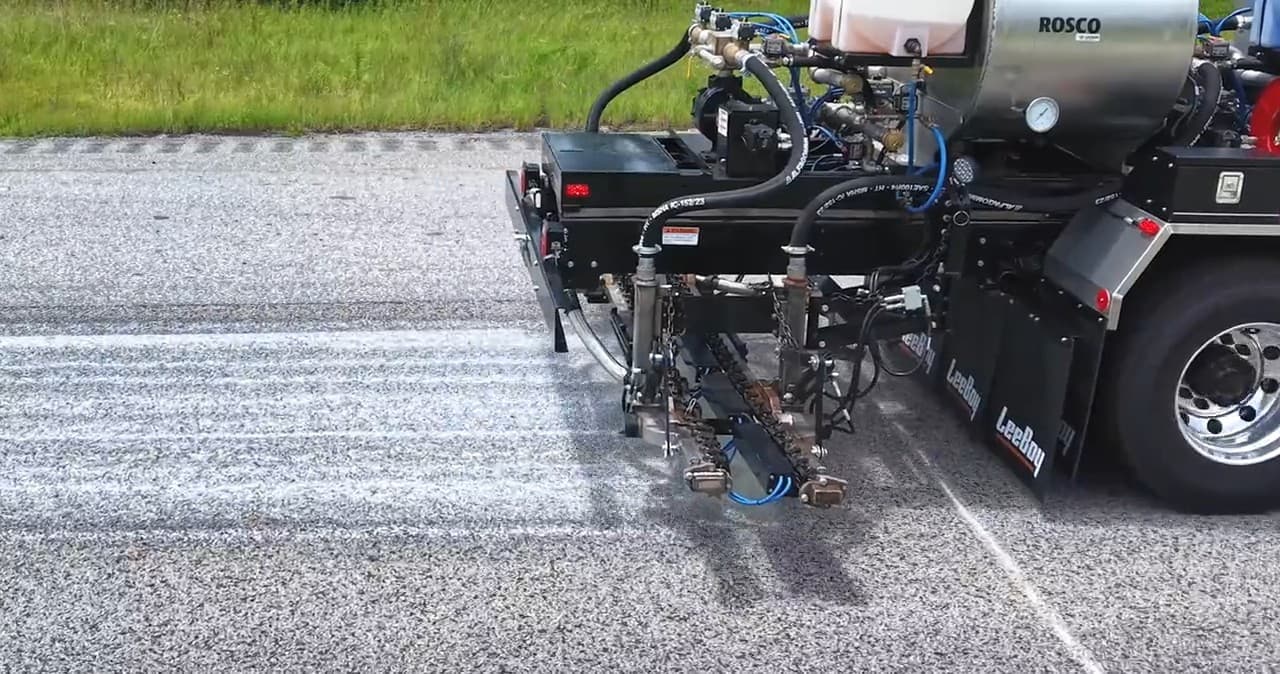

State specifications already regulate distributor rate control and verification. GDOT Section 424, for example, requires an adjustable distributor delivering 0.04 to 1.0 gal/yd² within ±0.02 gal/yd², with measuring devices the inspector checks before and after each application. The telemetry record is designed to align with that existing language: commanded and delivered rates per bar, deviation flags against the Engineer’s tolerance, and segment reconciliation against delivery tickets, in a format an inspector signs, not a calibration exercise the agency must run.
And the record cuts both ways, on purpose: out-of-tolerance intervals are flagged automatically, stay in the log, and are resolved under the contract’s acceptance criteria as documented corrective action. The result is a field-auditable link between the material specification and the delivered application, material by material, station by station.
Discuss agency specificationsSample segment record
- Supplier
- Qualified Supplier A
- Lot
- LOT A-26041102
- Target
- 0.0400 gal/yd²
- Tank temp
- 165 °F
- Supplier
- Qualified Supplier B
- Lot
- LOT B-26040873
- Target
- 0.0100 gal/yd²
- Tank temp
- 142 °F
Segment reconciliation
| Station | Time | Bar 1actual / target | Bar 2actual / target | Combinedgal/yd² | Ratioby volume | Deviationband = ±0.0025 gal/yd² | Status |
|---|---|---|---|---|---|---|---|
| 1265+00 | 22:17:52 | 0.0395/0.0400 | 0.0101/0.0100 | 0.0496 | 3.91:1 | -0.0004 | In tol. |
| 1265+50 | 22:17:59 | 0.0401/0.0400 | 0.0099/0.0100 | 0.0500 | 4.05:1 | +0.0000 | In tol. |
| 1266+00 | 22:18:07 | 0.0399/0.0400 | 0.0097/0.0100 | 0.0496 | 4.11:1 | -0.0004 | In tol. |
| 1266+50 | 22:18:14 | 0.0428/0.0400 | 0.0107/0.0100 | 0.0535 | 4.00:1 | +0.0035 | Out of tol. |
| 1267+00 | 22:18:22 | 0.0424/0.0400 | 0.0106/0.0100 | 0.0530 | 4.00:1 | +0.0030 | Out of tol. |
| 1267+50 | 22:18:29 | 0.0411/0.0400 | 0.0103/0.0100 | 0.0514 | 3.99:1 | +0.0014 | Adjusting |
| 1268+00 | 22:18:36 | 0.0437/0.0440 | 0.0110/0.0110 | 0.0547 | 3.97:1 | -0.0003 | Adjusting |
| 1268+50 | 22:18:44 | 0.0435/0.0440 | 0.0110/0.0110 | 0.0545 | 3.95:1 | -0.0005 | In tol. |
| 1269+00 | 22:18:51 | 0.0434/0.0440 | 0.0109/0.0110 | 0.0543 | 3.98:1 | -0.0007 | In tol. |
| 1269+50 | 22:18:59 | 0.0445/0.0440 | 0.0111/0.0110 | 0.0556 | 4.01:1 | +0.0006 | In tol. |
| 1270+00 | 22:19:06 | 0.0439/0.0440 | 0.0109/0.0110 | 0.0548 | 4.03:1 | -0.0002 | In tol. |
| 1270+50 | 22:19:14 | 0.0436/0.0440 | 0.0109/0.0110 | 0.0545 | 4.00:1 | -0.0005 | In tol. |
| 1271+00 | 22:19:21 | 0.0437/0.0440 | 0.0109/0.0110 | 0.0546 | 4.01:1 | -0.0004 | In tol. |
| 1271+50 | 22:19:28 | 0.0436/0.0440 | 0.0111/0.0110 | 0.0547 | 3.93:1 | -0.0003 | In tol. |
Event log extract
- 22:18:141266+50RATE-CHANGEOperator changed the combined target from 0.0500 to 0.0550 gal/yd²; the new target takes effect at Sta. 1268+00. Within the Engineer’s target band.
- 22:18:141266+50AUTO-FLAGCombined rate 0.0535 exceeded standing target by 0.0035 gal/yd² during ramp. Auto-logged. Ratio held 4.00:1.
- 22:18:221267+00AUTO-FLAGCombined rate 0.0530, deviation 0.0030 gal/yd². Ramp continuing.
- 22:18:291267+50AUTO-CLEARDeviation returned within ±0.0025 gal/yd². Total flagged length 100 ft.
Flagged intervals: 2 (100 ft), all associated with a documented target change and cleared within the same log. Tank draw reconciles to delivery ticket within 0.2 gal (A) and 0.1 gal (B). In a project record, the full interval set and complete event log accompany the submittal package.
The record above is illustrative: synthetic numbers demonstrating the record format, not data from a named project. Agencies evaluating the platform can request project telemetry samples under the appropriate agreements.
Start with a Pilot
A research pilot or experimental feature is the simplest way for an agency to evaluate the platform on its own network.